Friday, July 31, 2015

These Are the Most Vermin-Filled Cities in the U.S.(BusinessWeek)

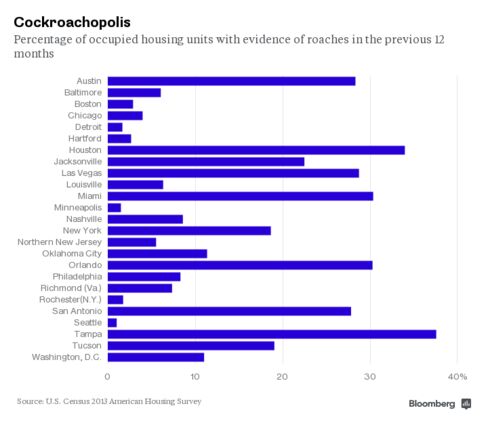
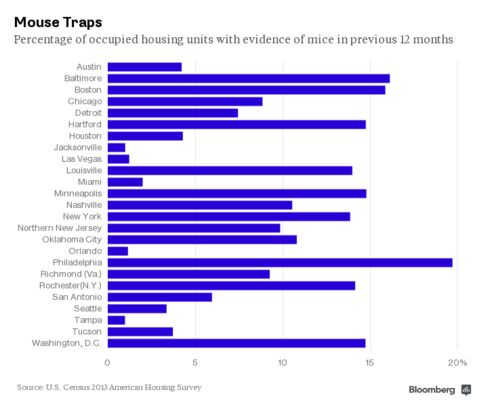
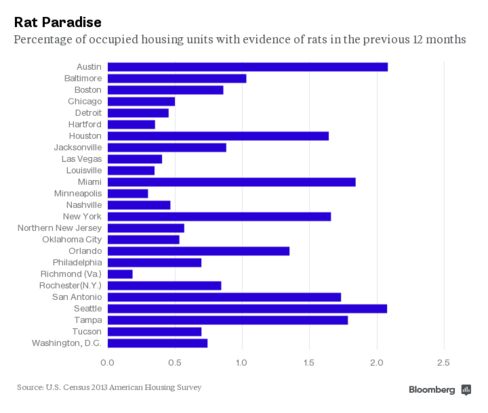
Roach motels, mouse traps, and rat nests

Tampa, Fla., is among the roachiest big cities in America. Seattle may be the rattiest. Philadelphia has more mouse sightings per housing unit than any other U.S. city. These are some of the filthy highlights from the U.S. Census Bureau's biennial accounting of rat, mouse, and cockroach sightings across the country. The most recent numbers, collected in 2013, were released last month.

The data comes from the American Housing Survey, which is conducted every two years. And it does have limitations. For one, the survey includes only households, so sightings in public areas like subways and sidewalks don't count. And in each installment, the Census breaks down detailed data for only 25 metropolitan areas. This year, the list included Chicago, Houston, and New York—but it didn't include Dallas, Los Angeles, or San Francisco.

Which means that while Richmond, Va., had the smallest share of households that reported signs of a rat among the 2013 cohort, it isn't necessarily the U.S. city with the fewest rats.
It's apparent from the data that the variety and quantity of vermin is at least partly determined by geographical factors. Mice were more likely to be found in colder, Northern cities. Roaches and rats seem to reproduce more rapidly in warmer climates.

So what cities appear to be the most and least infested overall? We ranked each city from 1 to 25 for each type of pest, with lower numbers meaning that sightings were less common. New York, allegedly the city of 2 million rats, had the highest cumulative score. (Austin was second.) Detroit ranked as the city where residents are least likely to report a mouse, rat, or cockroach—somewhat surprising given the blighted condition of the city's housing stock.

Despite its limitations, the data offers some insights into quality of housing and quality of life—and perhaps into the effectiveness of local public health efforts. The National Center for Healthy Housing links exposure to rodents and cockroaches to asthma and other health risks. In Boston, city officials have linked improved pest control to a sharp drop in asthma symptoms among public housing residents.

Compared with the national average, households living below the poverty line were 50 percent more likely to report evidence of rats or roaches. Black and Hispanic households were also far more likely to report those two categories of pests. Houses and apartments built in the last four years were far less likely to be visited by vermin.

Mice, however, were reported evenly across demographic lines. Squeak.


Monday, July 27, 2015

Uber’s Political Victory in New York, by the Numbers (BusinessSWeek)

Image result for Uber

The ride-hailing app faced off against the city’s mayor and won
Uber Chief Executive Officer Travis Kalanick has said he wants to refashion the car-booking company into a sort of politician to fight against the taxicab industry. Kalanick should get the confetti ready because Uber just won perhaps its biggest campaign yet. New York City Mayor Bill de Blasio backed down on a plan to stall the growth of Uber and similar ride-hailing apps.
Buried within the mounds of tweets, retweets, newspaper editorials, insulting app “features,” television commercials and press releases, a lot of stats have been thrown around by both camps in the hopes of swaying New Yorkers. Here are eight of the most cited numbers that helped shape the debate, and eventually tilted the campaign in Uber’s favor.
13,637 taxis
This is the number of taxicab licenses, known as medallions, that are in circulation in New York. Unlike with Uber cars, yellow cabs can pick up pedestrians using their old-fashioned hands to hail on the streets. Because the medallion supply is limited, they fetch high prices. Winning bidders for a batch of medallions sold in 2014 paid as much as $965,000.
19,000 Uber cars
The number of vehicles on Uber’s system in New York has surpassed taxis, according to company data. While Uber drivers can use their own cars and aren’t required to purchase pricey medallions, they still must register with the New York City Taxi & Limousine Commission, the same group that handles licenses for cab drivers. The commission, which also regulates private black car services, says it has more than 50,000 vehicles and about 100,000 drivers registered.
1 percent growth limit
The de Blasio-backed proposal, which drew the ire of Governor Andrew Cuomo and model Kate Upton, would have capped Uber’s growth at 1 percent a year. Uber says the number of vehicles on its system is expanding at about 3 percent a month. The company claims the limit would have doubled or tripled wait times for passengers.
100,000 new Uber riders a month
The company says it needs to keep adding drivers at a fast pace because its customer base is also expanding quickly. Uber says the bill would have allowed it to add 16 new drivers a month, which wouldn’t be nearly enough to accommodate 100,000 new riders
22 bankrupt taxi companies
Nearly two dozen companies owning 46 medallions filed for bankruptcy in Brooklyn on Wednesday. Evgeny Freidman, sole manager of the companies, said in a court filing that banks are hesitant to lend to medallion companies due to concern about competition from Uber.
$500,000 in campaign donations
The traditional taxi and limousine industry gave de Blasio’s 2013 mayoral campaign more than $500,000. The taxi industry also donated more than $150,000 to council members, including more than $8,500 to Ydanis Rodriguez, chairman of the Transportation Committee, who had committed to imposing the growth limits.
90 percent market share
There was a third candidate in this political campaign: Lyft, a much smaller ride-booking app. Diana Dellamere, public policy manager at the San Francisco startup, presented testimony to the New York City Council’s Transportation Committee on June 30, saying Uber controlled 90 percent of the market for car-booking apps in the city. Lyft's market share is 7 percent, and the company wouldn’t be able to catch up if the proposal were implemented, she said. “It would preserve and extend one company’s dominance while prohibiting others from offering a legitimately competitive service for consumers. Uber wins, while consumers, drivers, and competitors lose.”
$30 billion in annual wages
Employing a classic political tactic, Uber highlighted the importance of the technology industry to New York, suggesting de Blasio’s proposal was an attack on all tech workers. In a campaign organized partly by David Plouffe, a former strategist for President Obama who sits on Uber’s board of directors, Uber says tech in the city accounts for about 300,000 jobs and $30 billion in yearly wages. The company also says the proposed legislation could have caused the loss of 10,000 jobs—most of which are for Uber drivers, not employees of the company.

Friday, July 24, 2015

These Are the Top 20 Cities Americans Are Ditching (BusinessWeek)

Soaring costs of living meant residents left New York City and its suburbs in droves

New York City, Los Angeles, Honolulu: They're all places you would think would be popular destinations for Americans. So it might come as a surprise that these are among the cities U.S. residents are fleeing in droves. 

The map below shows the 20 metropolitan areas that lost the greatest share of local people to other parts of the country between July 2013 and July 2014, according to a Bloomberg News analysis of U.S. Census Bureau data. The New York City area ranked 2nd, losing about a net 163,000 U.S. residents, closely followed by a couple surrounding suburbs in Connecticut. Honolulu ranked fourth and Los Angeles ranked 14th. The Bloomberg calculations looked at the 100 most populous U.S. metropolitan areas. 

Interestingly, these are also the cities with some of the highest net inflows of people from outside the country. That gives many of these cities a steadily growing population, despite the net exodus of people moving within the U.S. 

So what's going on here? Michael Stoll, a professor of public policy and urban planning at the University of California Los Angeles, has an idea. Soaring home prices are pushing local residents out and scaring away potential new ones from other parts of the country, he said. (Everyone knows how unaffordable the Manhattan area has become.)

And as Americans leave, people from abroad move in to these bustling cities to fill the vacant low-skilled jobs. They are able to do so by living in what Stoll calls "creative housing arrangements" in which they pack six to eight individuals, or two to four families, into one apartment or home. It's an arrangement that most Americans just aren't willing to pursue, and even many immigrants decide it's not for them as time goes by, he said. 

In addition, the growing demand for high-skilled workers, especially in the technology industry, brought foreigners who possess those skills to the U.S.  They are compensated appropriately and can afford to live in these high-cost areas, just like Americans who hold similar positions. One example is Washington, D.C., which had a lot of people from abroad arriving to soak up jobs in the growing tech-hub, Stoll said. 

Other areas weren't so lucky. Take some of the Rust Belt cities that experienced fast drops in their American populations, like Cleveland, Dayton and Toledo, even though they are relatively inexpensive places to live. These cities didn't get enough international migrants to make up for the  those who left, a reflection of the fact that locals were probably leaving out of a lack of jobs. 

This is part of a multiple-decade trend of the U.S. population moving away from these manufacturing hubs to areas in the Sun Belt and the Pacific Northwest, Stoll said. Retiring baby boomers are also leaving the Northeast and migrating to more affordable places with better climates. 

This explains why the majority of metropolitan areas in Florida and Texas, as well as west-coast cities like Portland, had an influx of people.

El Paso, Texas, the city that residents fled from at the fastest pace, also saw a surprisingly small number of foreigners settling in given how close it is to Mexico. 

"A lot of young, reasonably educated people are having a hard time finding work there," Stoll said. "They're not staying in town after they graduate," leaving for the faster-growing economies of neighboring metro areas like Dallas and Austin, he said. 

Methodology: Bloomberg ranked 100 of the most populous U.S. metropolitan areas based on their net domestic migration rates, from July 1, 2013 to July 1, 2014, as a percentage of total population as of July 2013. Domestic migration refers to people moving within the country (e.g. someone moving from New York City to San Francisco). A negative rate indicates more people leaving than coming in. International migration refers to a local resident leaving for a foreign country or someone from outside the U.S. moving into the U.S. 


Wednesday, July 8, 2015

Technology Events in South Florida


REGIONAL TECH CALENDAR 
South Florida Technology Alliance
Building a connected and collaborative technology community
SFTA Newsletter/July 7 2015
Click to Visit Our Sponsors' webpages
PLATINUM SPONSORS


GOLD SPONSORS


TECH & MEMBER NEWS HEADLINES: 
Thursday, July 16
WHERE
Funky Buddha Brewery
1201 NE 38th Street
Oakland Park, FL 33334

FUN
  • Tour of the brewery (limited availability)
  • Free beer ticket for the first 25 registrants
  • Raffle for an iPad Mini 16 GB w/ WiFi
Additional sponsorships available.  Email Doug Saenz.

SPONSORS


Certified Business Analyst Available 
SFTA member is Certified Business Analyst, Six Sigma Green Belt & IT professional

Senior Business Analyst  (CBAP) with technical experience and a mix of PM and Process Improvement skills; has worked in financial services, cruise line and healthcare industries.  

Click here to review the resume.

Thanks you for helping to grow and keep our skilled IT professionals!
PCWorld, July 7, 2015
ComputerWorld, July 7, 2015   
The Telegraph, July 7, 2015
ProgrammableWeb, July 7, 2015
Fast Company, July 7, 2015
ProgrammableWeb, July 6, 2015
CHECK OUT TECH EVENTS & ACTIVITIES ON OUR REGIONAL CALENDAR 

Monday, July 6, 2015

Life, Liberty, and the Pursuit of Happiness: How the 13 Colonies Rank Today (BusinessWeek)

Does the promise of the Declaration of Independence hold true in 2015?

Let's start with life—or really, life expectancy. Only seven of the 13 original colonies beat the U.S. average of 78.9 years.


How about liberty? One measure of liberty is the incarceration rate. All 13 original colonies have lower incarceration rates than the U.S. average of 497 per 100,000 residents.

Life, liberty and the pursuit of happiness was the promise of the Declaration of Independence. Almost 240 years later, how do the 13 original colonies stack up in those three measures?


When it comes to the pursuit of happiness, the 13 original colonies aren't at the top of the list. Let's look at these states' ratings in the Gallup-Healthways Well-Being Index, which measures purpose, social, financial, community, and physical elements in peoples' daily lives. None of the original colonies ranked among the top 10 happiest states by this measure. Virginia ranked the highest of the group, at No. 14, followed by Massachusetts at No. 17.


This story is based on Bloomberg Brief's interactive StoryChart on the 13 original colonies.